Home » Shop » Interfacing » J1939 Doctor – J1939 Diagnostic Tool

J1939 Doctor – J1939 Diagnostic Tool

474,00

“Self contained J1939 diagnostics tool with physical network and data analysis on your phone, tablet, PC or MAC.”

Description

KEY FEATURES

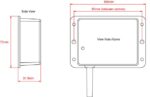
The J1939 protocol is increasingly being adopted in marine applications, providing monitoring and control for engines, propulsion systems, generators, and electrical networks. To support this trend, a self-contained J1939 diagnostics tool has been developed, featuring a built-in web interface that allows any device with a browser to connect and analyze data seamlessly. With wireless connectivity to mobile devices, users can access critical information from anywhere on the vessel without the need for physical connections.

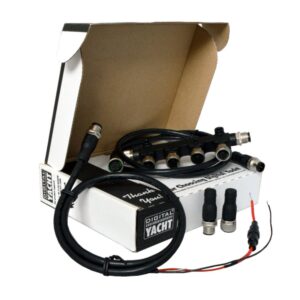
This diagnostics tool not only monitors the J1939 network but also checks its physical characteristics, including voltages, bus load, and frame errors. Users can view all devices connected to the network and drill down into specific data for detailed analysis. Its flexibility is enhanced by an M12 connector, which supports a wide variety of third-party patch cables and breakouts, making it compatible with diverse setups.

Easily monitor and manage device fault codes with our user-friendly interface. Click the Fault (Red Cross) icon to view active and historical codes in a clear pop-up. The DM1 Table displays the currently active fault codes, while the DM2 Table provides a record of historical faults.

If a fault condition remains active after clearing, the system automatically detects and displays it again during the next PGN transmission, ensuring you always have accurate, up-to-date diagnostic information at your fingertips.

For more in-depth analysis, you can also view detailed information for a specific PGN by clicking the Info icon located at the end of that PGN’s row. This will open a pop-up window  displaying all relevant data for precise monitoring and troubleshooting.

Powering the tool is equally versatile. It can draw power directly from the J1939 network (12/24V) or operate from a separate DC supply through the breakout connection. To support reporting and documentation, the tool allows users to print detailed network reports directly from the browser, just as they would with any standard document, simplifying record-keeping and diagnostics.

OPERATION

You can configure the J1939 Doctor  through its own simple web interface, just open your web browser, enter the J1939 Doctor’s IP address and you can access the J1939 Doctor web interface. So no complicated programming software or app required.

Through the web interface, you can analyse all the equipment connected to the network and get additional information about the equipment. You can also display all of the PGNs being received.

The health section gives you an overview of the network (supply voltage, bus capacity, etc.).

SPECIFICATIONS

  • J1939 increasingly used on boats for engine, propulsion, generator and electrical monitoring
  • Self-contained J1939 diagnostics tool with built in web interface allowing any device with a browser to connect and analyse data
  • Wireless connectivity to the mobile device
  • Checks physical characteristics of the J1939 network such as voltages, bus load and frame errors
  • Allows viewing of devices and data on the J1939 network
  • Drill down on data for analysis
  • Fitted with M12 connector from which a wide variety of 3rd party patch cables and break outs can be connected
  • Can operate from J1939 network power (12/24v) or from separate DC supply via break out
  • Print reports of the network via the browser just as you would any document
Additional information
Dimensions 105 × 72 × 32 mm
Manual and Downloads

J1939 Doctor

882 KB

Quick start guide for J1939 Doctor Wireless J1939 Diagnostic and Test tool.

what inside box

  • 1m drop cable with male M12 Device Net connector
  • WiFi antenna built-in
  • Videos

    FAQs